


Gro-Trac®
Gro-Trac® is the first equine growth-monitoring software that allows breeders to compare the growth rates of their stock with those of young horses of similar age, sex and breed from the same country, or from around the world. For well over 25 years, thoroughbred breeders internationally have been working with scientists at Kentucky Equine Research collecting growth data from their young thoroughbreds. This has led to the largest set of growth records in the world being collected by Kentucky Equine Research, and it is added to on a daily basis.
Body weight, wither height, and body condition score data has been collected from over 50,000 Thoroughbreds in the USA, England, Ireland, France, Australia, New Zealand, South Africa, and India. By using this extensive database of growth records, breeders can quickly assess, track and manage foals and yearlings from birth within the Gro-Trac® programme.
A newly upgraded version of Gro-Trac was made available last Summer, and it has already been hailed as a 'game-changer'.
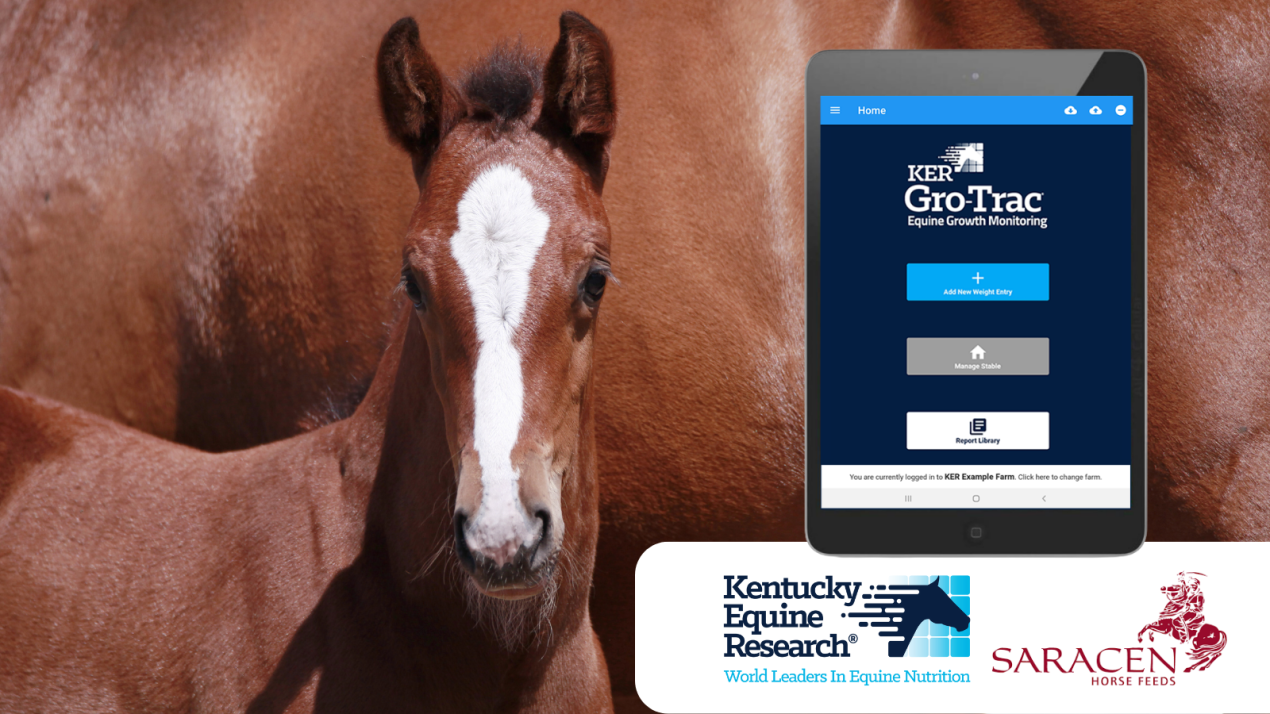
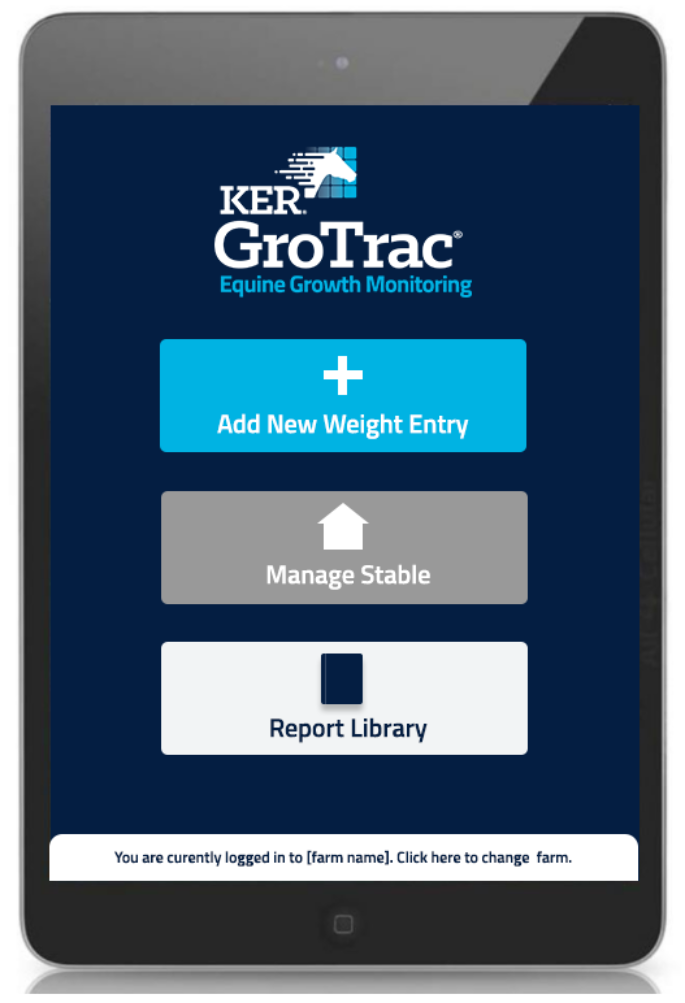
This updated version of Gro-Trac has a new look and feel. Browser-based, it works on Windows or Apple computers and is compatible with all iOS or Android devices. It has a range of new commenting features, reports and photo libraries. The data syncs with the cloud for up-to-date access anywhere. You can quickly enter weight and height data on a tablet or your phone and the camera on your device will easily add photos to your entry. The mobile app is a convenient way to enter data, view and manage horse records and check reports on the go.
Saracen provides the KER Gro-Trac® programme as a free service to stud farm clients.
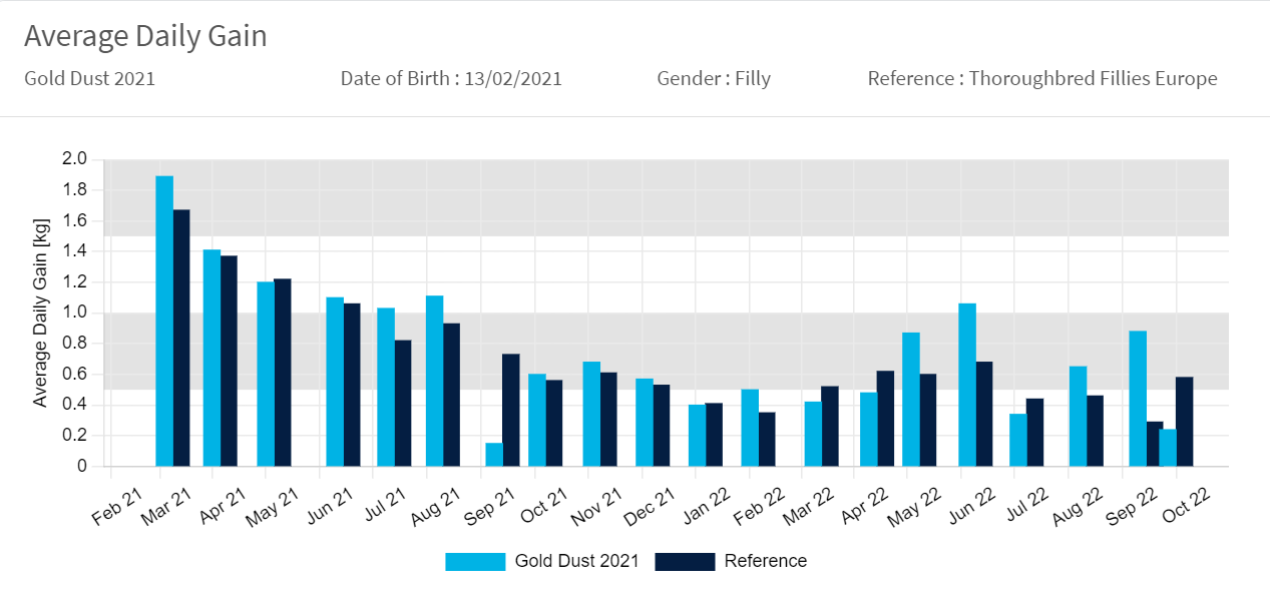
The programme features growth curves generated from data collected (weights, heights and average daily gains) from literally thousands of young horses. Reference curves can include a broad range of growth data by gender and geographical location (eg. European Thoroughbred Colts or European Thoroughbred Fillies).
The innovative graphical design of the data displayed lends physical meaning to once abstract measurements. In each chart, the foal’s measurement is compared to the selected reference group chosen by the user, showing the growth curve for the young horse as well as the reference group.
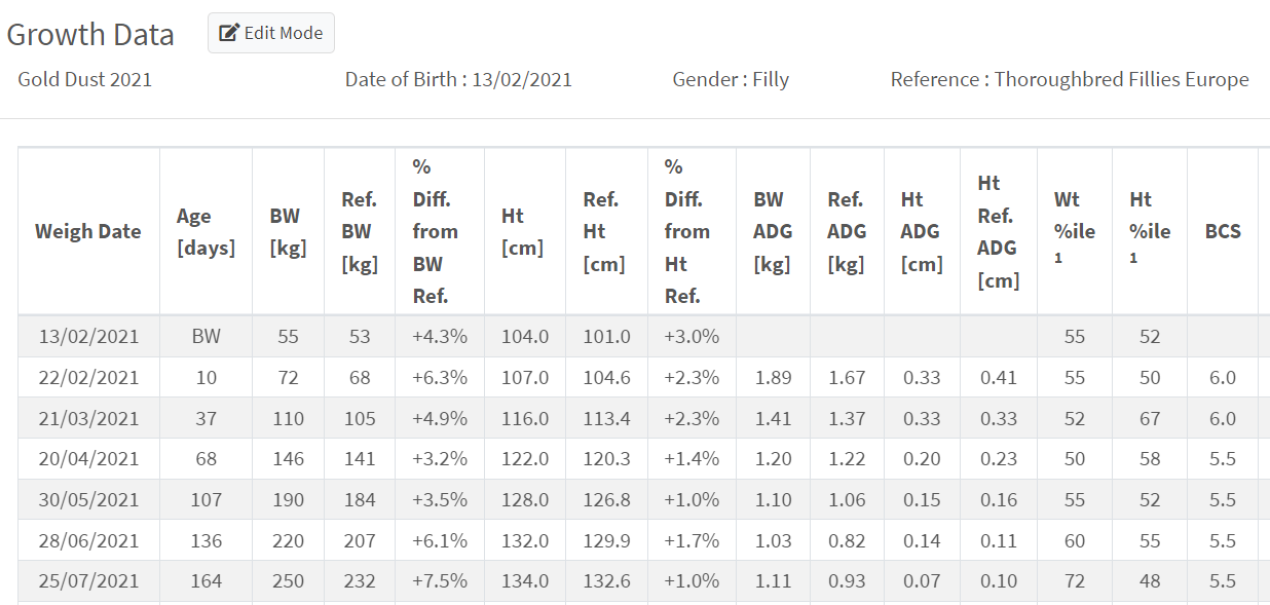
Growth measurements are displayed by way of graphs and bar charts for quick visual assessment.
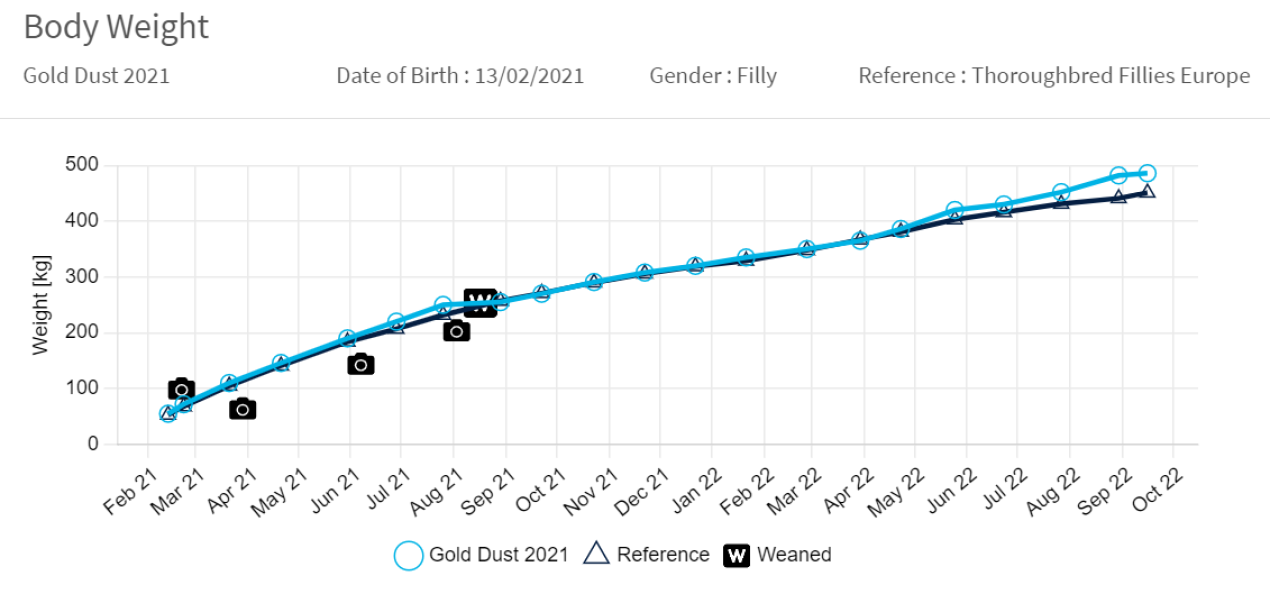
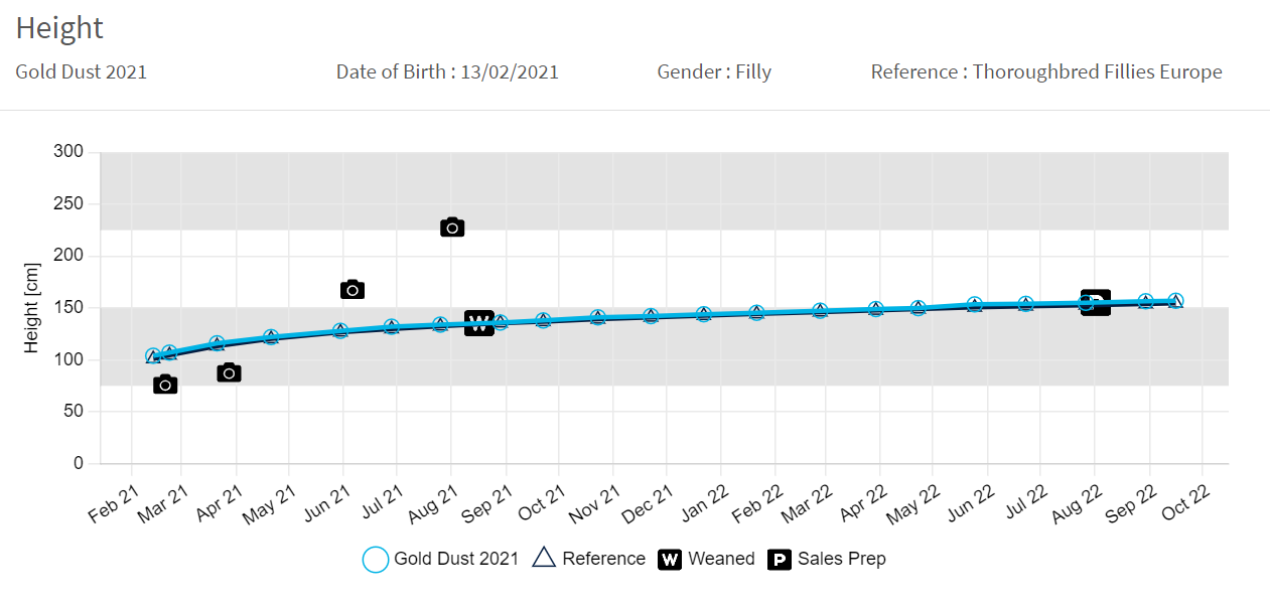
Specific farm and group averages can also be calculated and measured against the desired reference group. The information presented in these visuals can include the body weight and condition score of the mare. In addition to the charts and graphs, photographs can be imported into the programme to show physical changes from month to month, as well as digital x-rays. Pertinent comments can be added at any time – examples include management issues that may affect growth such as weaning dates, feed changes or illness. These comments can explain a slowdown in growth following an illness or if a foal took weaning harder than expected. Symbols signifying the presence of a photograph or comment will appear on the graph at the time each one is entered.
These features create an ongoing history of each foal, making Gro-Trac® a valuable management and communication tool. Easy-to-read, customised reports can be generated by the programme in Adobe PDF format, which can include the height and weight graphs, Average Daily Gain bar graphs, Percentile graphs, photos, and narrative reports, and these can be sent electronically. It makes it much easier for owners who cannot see their horses regularly to follow and keep abreast of their development with a full and accurate report on how their foal is progressing.
The programme is not meant to replace your eye, but it can help to quantify what you are seeing, give reliable comparisons between age groups and genders, and make it easier to aim for more consistent growth rates.
Gro-Trac® has a built-in feature that allows the user to share data confidentially over the internet. Owners can view detailed growth data to stay in touch with the progress of their horses, and information on horses from separate divisions of one farm can also be compared together.
Traditionally, Gro-Trac® has provided an indication of how a horse is growing compared to the chosen reference population by indicating the percentage that the individual differs from the reference values for height and weight. This method is very useful, but it does not take into account the spread of the data around the average. For example, there is a much wider range for a horse’s body weight than for wither height at a particular age. Body weights can differ by as much as 50 kg, whereas differences in height will be only a few centimetres. A horse that is four percent above (+4%) the reference body weight is not that much heavier than the average, but if he is four percent (+4%) above the reference height, then he is a lot taller.
Using percentiles, breeders can quickly and meaningfully appreciate how an individual compares to the population.
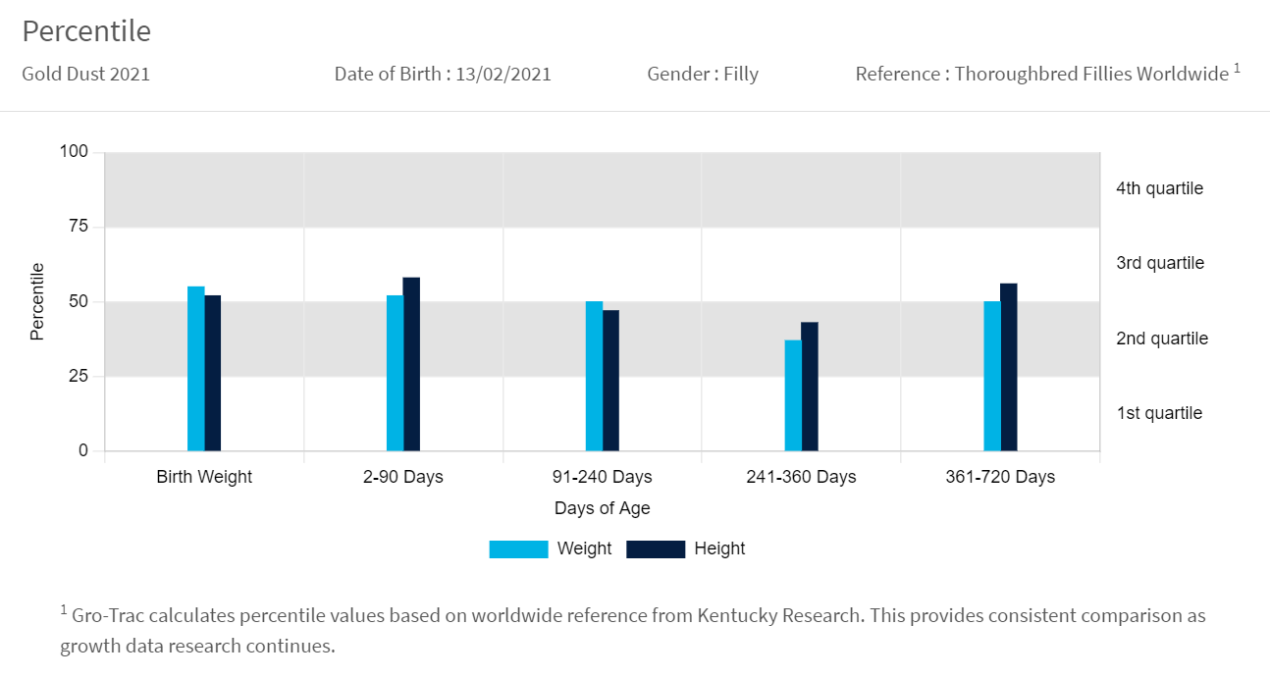
Percentiles deal with this data spread issue and allow a more relative comparison with the entire population. Furthermore, this method allows horses to be compared regardless of gender and age. The use of percentiles is not a new concept in growth studies and is commonly used in paediatrics. However, this is the first time such a large equine data set has been acquired to create reference populations from which percentiles can be calculated for Thoroughbred horses. For example, the population mean or average is the 50th percentile, where half the population are either above or below it. A colt that is in the 90th percentile for height and 75th percentile for weight is taller than 90% of the population and heavier than 75% of the population, so he is well above average.
Many breeders using the software agree that Gro-Trac® is an objective management tool. The programme keeps a complete management history of each foal, so farm managers can quickly flag youngsters that are experiencing changes in body condition, some of which might be overlooked by even the most observant caretakers. In other instances, the software validates opinions about a certain horse. This information can be archived to be useful for reference in the future. This can be particularly interesting with a permanent broodmare band when patterns and trends will often emerge.
Breeding Services
Our range of specialist thoroughbred breeding feeds and services has been developed through exclusive nutrition partnerships with Hallway Feeds and Kentucky Equine Research, both based in Lexington, Kentucky, since April 2000
Download our body condition scoring chart